Two observability reports published this month reach a similar conclusion: many companies keep far more technical data than they use, and that data rarely shapes business decisions. Cisco released State of Observability 2026 on 20 October 2026, based on a survey of 2,050 ITOps and engineering professionals across ten countries and sixteen industries. Grafana Labs and ETR published The State of Observability, 2026, drawn from a June 2026 survey of 300 IT decision-makers at director level and above.
Observability is the ability to understand what is happening inside a system from the data it emits: logs, metrics and traces. It sounds deeply technical, but the findings touch something business owners care about: bills that keep rising, and the question "what do we actually get from all this data?"
The cost driver is not AI, it is chatty logs
The author of the Cisco report, Kamal Hathi, says he expected AI infrastructure to be the biggest observability cost driver. Only 6% of respondents named it as their top driver. At the top of the list were excessively verbose logs, the old habit of collecting data "just in case".
Grafana's report shows the cost pressure is real. 78% of respondents said observability spend rose over the past year, and 73% expect it to rise again in the next 12 months. The reasons vary: new products added to the observability stack (61%), wider coverage because AI-accelerated development creates more to watch (60%), business growth (51%) and vendor price increases (49%).
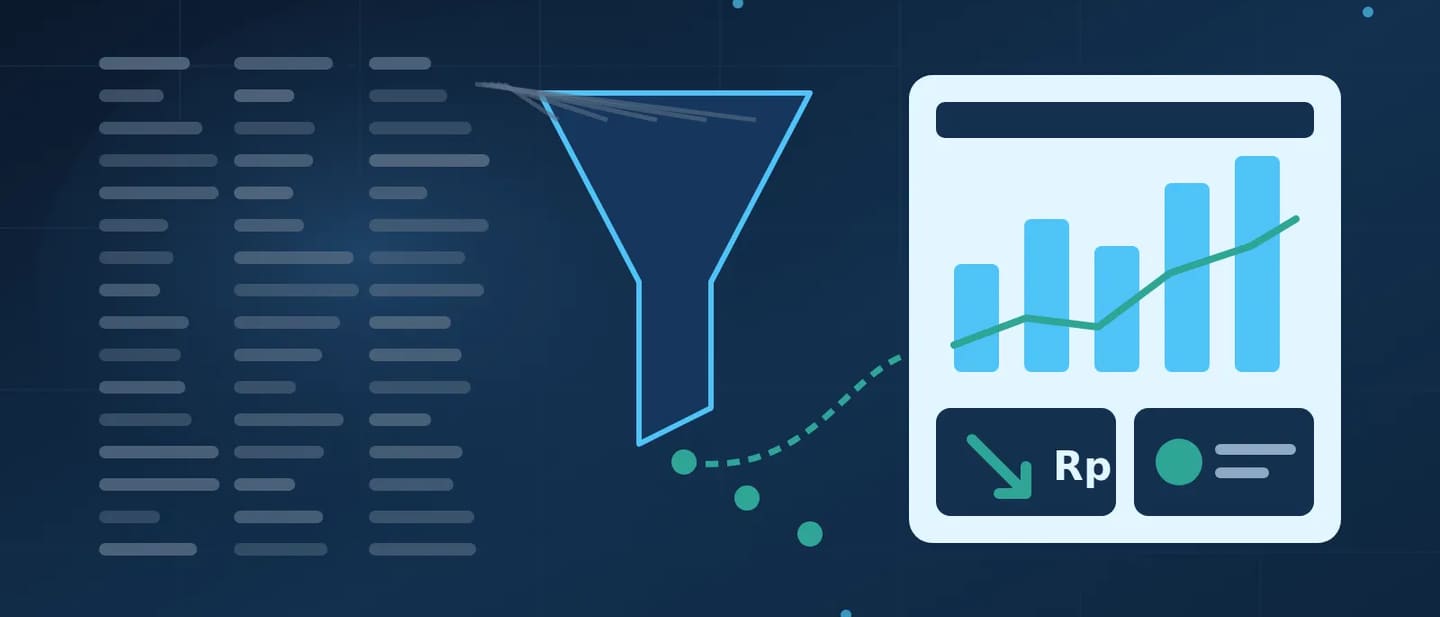
Almost all Grafana respondents (97%) see at least some value from that extra spend. Yet 36% of them say they cannot yet quantify that value cleanly. On the Cisco side, nearly half of respondents admit telemetry data is not a key factor in their organisation's strategic planning.
Put the two findings together and the pattern is clear: data piles up, costs climb, but the link to business decisions never gets built.
What the "leaders" do differently
Cisco separates out a top-performing group it calls leaders. They practise three habits together: putting AI agents to work routinely to fix and prevent issues, extending observability to govern AI behaviour (model quality, cost, usage, security and privacy), and embedding telemetry directly into business planning.
Interestingly, they do not keep more data. They are more disciplined. According to Cisco, leaders sample and route data far more aggressively, so they pay only for high-value signals. As a result they are more than twice as likely to say all their observability data is readily accessible and immediately queryable. They are also 2.4 times more likely to say their observability ROI significantly exceeds expectations, and 54% report at least 5 million US dollars in annual business value.
On AI, leaders are more honest about the difficulty. 57% of them say monitoring AI adds complexity to their jobs, against 38% of other respondents. But 91% have clearly defined ownership and accountability for monitoring AI, against 59% of everyone else, and 76% say they can accurately control AI costs.
Trust in AI still comes in tiers
Grafana's report offers a realistic picture of how much autonomy teams will grant. 85% of respondents are comfortable with AI doing read-only investigation, and 84% with AI recommending a fix. That drops to 56% for AI making code or configuration changes, 52% for full autonomous remediation and 50% for deploying changes to production.
For LLM-powered applications, 80% of responding organisations are building or running them, with 42% already in production. Yet only 44% of those building or piloting such applications watch cost attribution, and unclear cost attribution across models and teams is the top challenge (25%).
What this means for businesses in Indonesia
Companies in Indonesia, from e-commerce and fintech to logistics, clinics and hotels, do not need thousands of servers to see the same pattern. Cloud logging bills, overlapping monitoring subscriptions and dashboards nobody opens are common symptoms. Here are practical steps you can start without buying a new tool:
- Start from business questions, not from data. Write down five to ten questions management actually wants answered, such as "what share of payments fail at peak hours?" or "how long do orders wait before dispatch?". Data that does not help answer an operational or business question deserves scrutiny.
- Audit log volume per service. Find the services that produce the most logs and check their levels. Debug logging left on in production is often a big contributor. Lower the level, and move logs needed only for audit to cheaper storage.
- Apply sampling with clear rules. The OpenTelemetry documentation explains that for high-volume systems, a sampling rate of 1% or lower is often highly representative. With tail sampling, traces containing errors or high latency can always be kept while only part of healthy traffic is stored. Make sure these rules do not conflict with any data retention obligations that apply to your business.
- Give every dashboard and alert an owner. Alerts without owners tend to be ignored. The same principle applies to spend, as we discussed in cloud spend needs owners.
- Link technical metrics to business metrics. Show checkout latency next to conversion rate, or courier API response time next to delivery delays. One shared dashboard for technical and business teams beats ten separate ones.
- Measure AI from day one. If you run a chatbot or AI agent, record token usage, cost per feature or per team, latency and answer quality. This fits our notes on cost and control for production AI agents.
- Raise AI autonomy step by step. Start with AI that only reads and recommends, then grant rights to change configuration once there is an accuracy record and clear human approval.
How MarkasDev helps
MarkasDev works as a Technology Partner, in three phases:
- Diagnose: map existing log, metric and trace sources, cost per source and the business questions they should answer, then flag data that is expensive but unused.
- Deliver: set up the telemetry pipeline, sampling and retention rules, owned alerts and dashboards that connect technical and business metrics, with written acceptance criteria.
- Operate: a retainer with SLA and monitoring to keep those rules relevant as systems change. We explain how this differs from plain fixes in Maintenance vs Operate.
If your logging and monitoring bills keep rising while management meetings still run without operational data, book a Diagnose session to check what you really need to keep.
Sources
- Cisco Blogs, Kamal Hathi, "State of Observability 2026 Reveals How Leaders Are Restoring Predictability to the Agentic Era" (20 October 2026): https://blogs.cisco.com/news/state-of-observability-2026-reveals-how-leaders-are-restoring-predictability-to-the-agentic-era
- Grafana Labs and ETR, "The State of Observability, 2026" (June 2026 survey): https://grafana.com/analyst-reports/executive-survey/
- OpenTelemetry, "Sampling" (concept documentation): https://opentelemetry.io/docs/concepts/sampling/